UI tour
-
Get Started
The fastest way to bring the stack up and learn the “happy path”.
-
Dashboard
System status, monitoring links, storage, help, and glossary.
-
Get Started
The fastest way to bring the stack up and learn the “happy path”.
-
Dashboard
System status, monitoring links, storage, help, and glossary.
-
RAG
Retrieval, graph views, indexing, reranker config, and learning studios.
-
Admin
Basic, advanced, and raw configuration plus dependency and secret readiness.
Quickstart Indexing Searching Configuration
Default dev URL
http://127.0.0.1:5173/web
How the UI talks to the backend
In dev, the UI uses relative requests like /api/search and your dev server proxies them to the backend (default http://127.0.0.1:8012).
flowchart LR
  UI["Vite UI (5173)"] --> API["/api/* (proxy)"]
  API --> BE["Backend (8012)"]
  BE --> PG["Postgres"]
  BE --> N4J["Neo4j (optional)"]
UI snapshots (current surfaces)
Chat + dataset iteration loop
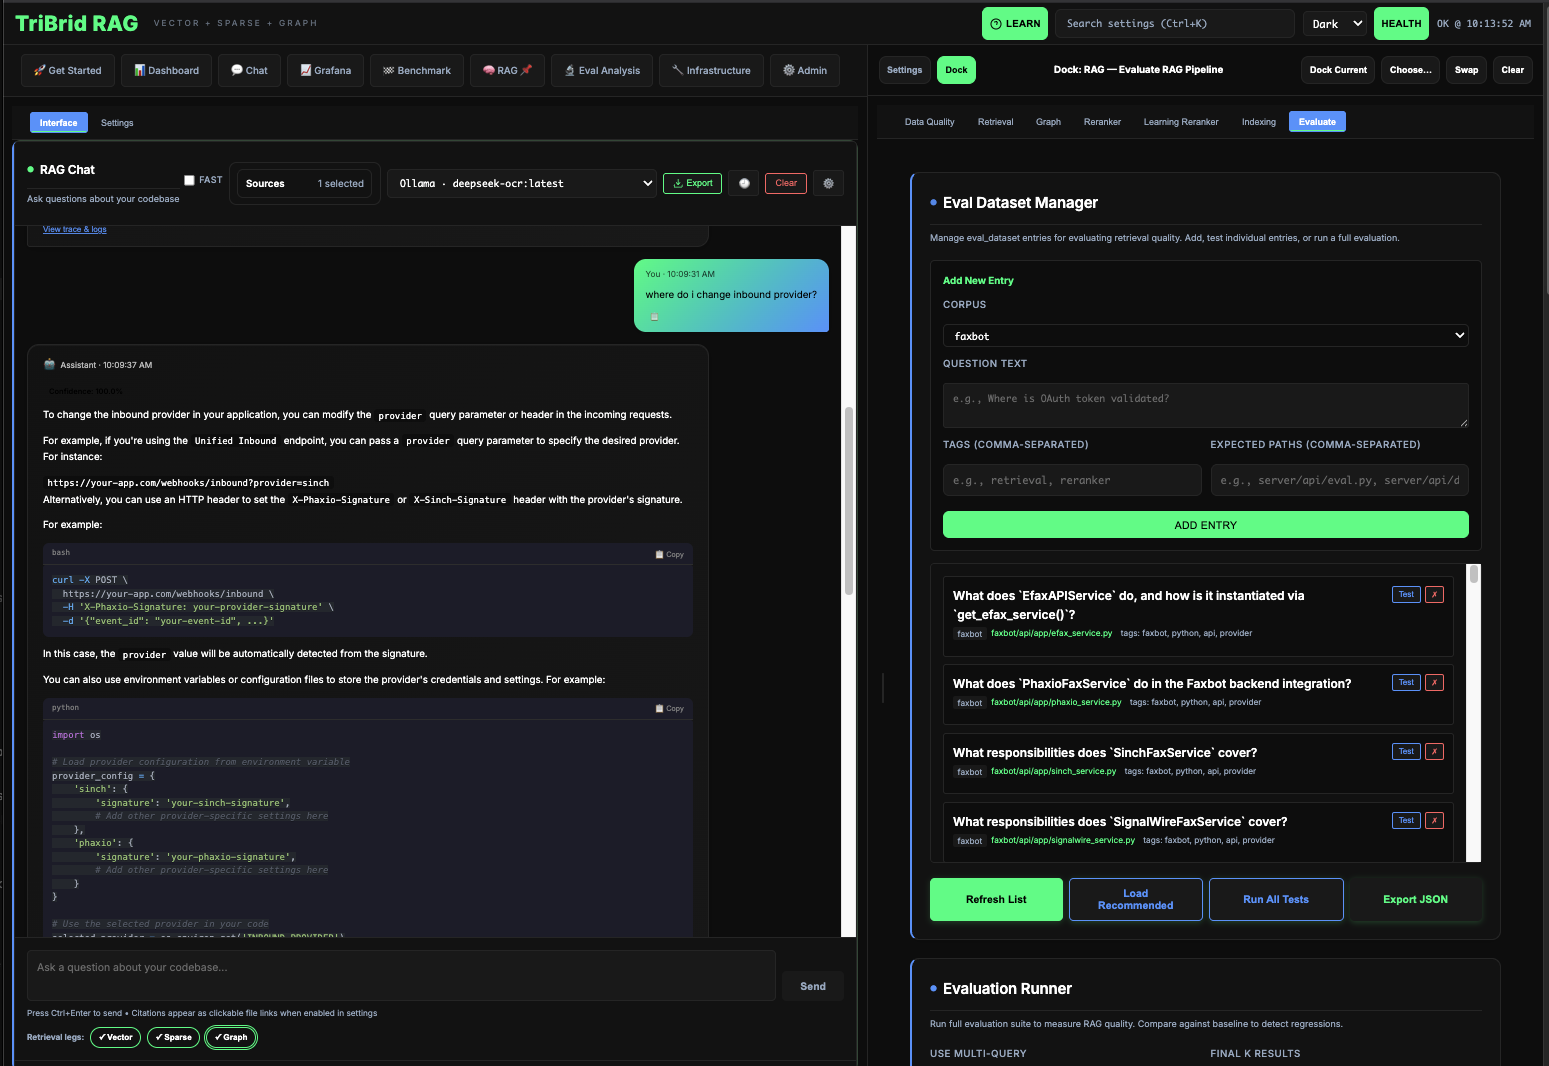
This is the core operator loop: ask, inspect sources, adjust retrieval settings, and re-run.
RAG graph inspection
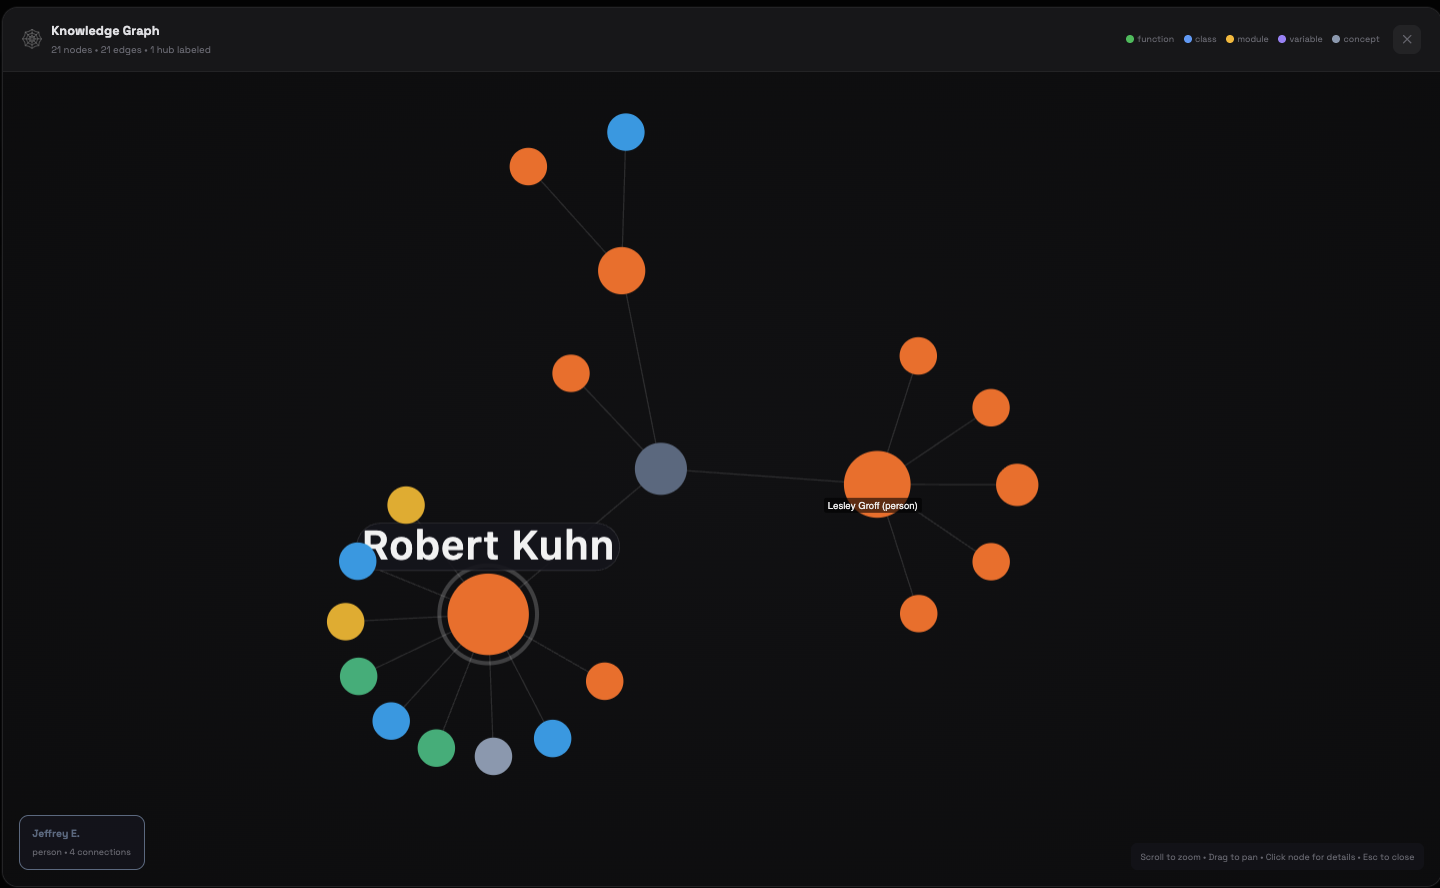
The graph view is where you validate entity extraction quality and relationship coverage. Communities are GDS Leiden partitions derived at index time — re-index the corpus to refresh them.
Entity and relationship types are whatever the graph actually stores: AST kinds (function, class, module) for code corpora, and the approved schema's labels (Tank, LaunchSite, CONTAINS, LOCATED_AT, …) for semantic corpora — never coerced to a generic "(concept)" fallback. Schema-labelled entities get a stable palette colour keyed by the label text, and every view (entity table, neighbourhood, communities) returns the stored schema edges, so a semantic generation shows real edge counts instead of "0 edges".
Entity names come from the graph too: an entity stored without a name — possible only on generations approved before the proposal's name identity rule — is labelled with its stable entity id instead of an empty name, and it reads back over the API as an empty string, never the text None. Newer generations always carry a name; see the Indexing pipeline.
The entity details panel now shows what the graph actually extracted: a Properties chip row listing every stored schema or AST property (qualname, kind, start_line, pressure, ullage, …), with derived community membership shown separately — Community: <id> plus its path when Leiden produced a multi-level partition — because communityId/communityPath are written at index time by the community pass, not extracted, so they are never presented as extracted properties. An entity with nothing stored says "none extracted". The File line is provenance-backed for semantic entities too: a semantic entity stores no file of its own, so the view reports the file of the chunk it was extracted from (FROM_CHUNK), and an entity without provenance reads File: — honestly rather than guessing. These behaviors are pinned end to end in web/tests/e2e/exhaustive/graph_explorer.spec.ts; see Graph API.
Recall gating and memory policy controls
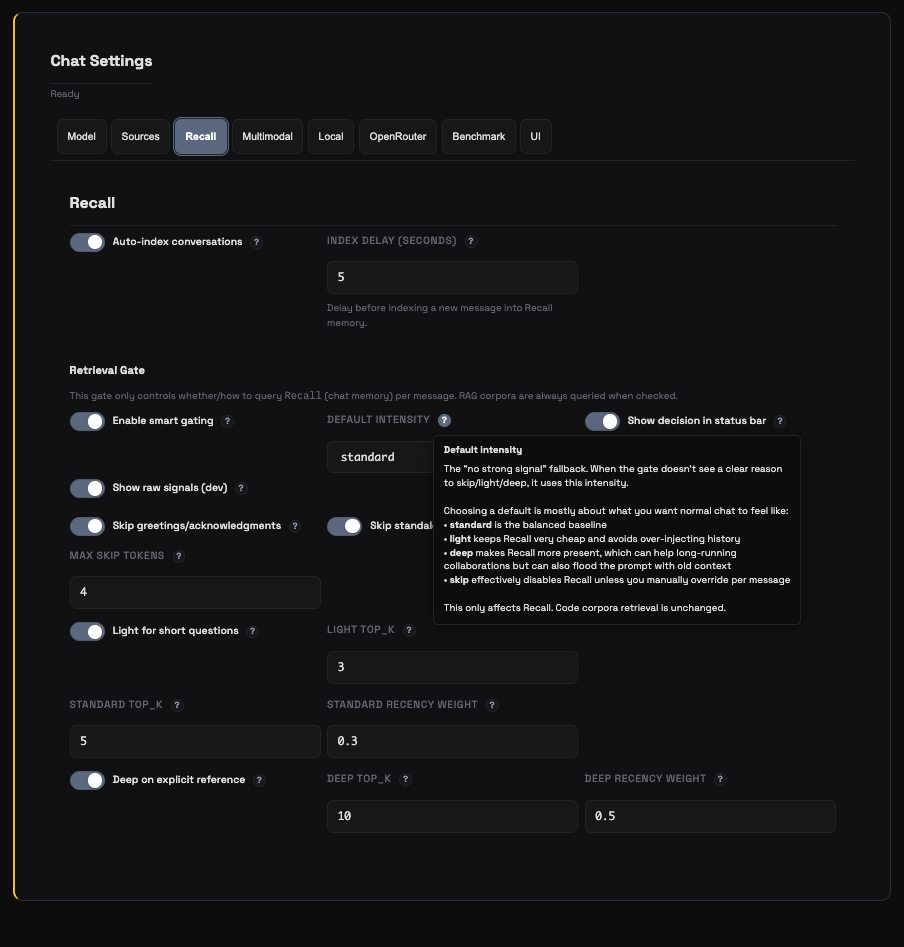
This panel controls when memory is indexed and when recall is injected per message.
Citations open the actual source
Every citation under a chat answer is clickable. PDF citations render as a page-thumbnail card with the cited region boxed; text citations open the file scrolled to the cited lines. Either way the document opens in the right rail's Source mode, so you can verify evidence without leaving the chat.
Figure citations are flagged on top of that: a citation whose chunk is a described figure (see Indexing a corpus) carries a Figure pill — Figure · chart when the vision model named a kind — and the page viewer labels its text panel Figure description instead of Cited text. Ordinary page-text citations are never marked.
- Source viewer guide: Source document viewer
- Web-search citations: Web search in Chat
Chat model choice survives reloads
Your selected chat model is saved per conversation. On page load, the model picker keeps that saved override while /api/chat/models is still loading — it is no longer reset just because the model catalog has not arrived yet. Once the catalog responds, the picker confirms the saved model is present and keeps it selected.
Why this matters: if you pin a specific LiteLLM gateway alias for your conversations (for example, a production chat model that differs from the vision override), a refresh no longer silently drops you back to the default before the catalog finishes loading. The picker simply stays on your saved choice until the server confirms the option list.
The picker reads a generation-scoped catalog: /api/chat/models filters to GEN capability, so embedding gateway aliases (for example openai.text-embedding-3-small) never appear as chat models even though they are rendered into the same LiteLLM config. See Model catalog.
If the picker stays disabled
The picker enables once /api/chat/models responds. If it never does, check:
GET /api/chat/health(default dev basehttp://127.0.0.1:58012/api) for provider readiness- The LiteLLM gateway service on port
54000(see the runtime topology for the full service map)
Chat reliability: Stop, Retry, Export, and honest sources
A handful of chat behaviors changed so the thread never lies to you:
- Stop always lands. Pressing Stop (or hitting the stream timeout) finalizes the in-flight answer as an interrupted, retryable error card — it can no longer sit at "Streaming" forever. A page load reconciles any abandoned running bubble the same way, and the card's Retry replays your question without duplicating it.
- Streaming shows progress. While an answer streams, the header shows a live elapsed counter (
Streaming · 12s) instead of a static label. - Attachments say what they are. The composer preview shows each image's name, type, and size; non-image files are refused with a toast naming them (previously dropped silently); and the answer's Sources block lists attached images as real inputs (
N attached images used as an answer input). - Sources are labeled. The Sources header carries a count; Recall citations read
Recall · <first line of the recalled turn>instead of a rawconversations/<id>.mdpath; and the source dropdown summary counts corpora and Recall separately (2 corpora + Recall, never a bare3 selected). - History shows context. Each chat-history row carries badges for the corpora (plus Recall) the conversation used.
- Export works and confirms. Export downloads a JSON file reliably and shows a toast with the filename; an empty chat says "Nothing to export yet".
- One prompt system. Exactly one of the four state prompts (Direct / RAG / Recall / RAG+Recall) is sent, chosen by whether RAG and/or Recall context is present; the legacy base+suffix fallback composition is gone. Set them in Chat → Settings.
- One markdown renderer. Assistant answers (and onboarding answers) render through a single GFM renderer — tables, bold, inline code, fenced code with syntax highlighting, and nested lists all render, and wide content wraps inside the pane instead of growing it sideways.
- The debug footer discloses the graph leg. When a message's retrieval ran the graph leg, its debug footer shows the leg's own counters —
graph_enabled,graph_qdrant_seed_chunks,graph_relationship_expansion_hits,graph_hydrated_chunks— read straight from the chat debug contract (ChatDebugInfo), and never the retired entity-hit figure. See Chat models. - A failed answer says why, and the trace follows it. When generation fails, the error card classifies the gateway's sanitised reason (
spend limit,rejected key,serving lane not running,gateway unreachable) and shows it in Details together with the run id; the Routing Trace panel follows the failed run instead of the previous successful one. See Chat models. - The trace panel says when a run came from somewhere else. With no answer in the conversation yet, the Routing Trace panel falls back to the corpus's most recent run — which a Retrieval-tab search, an MCP probe, or another tab can have produced. It now labels that fallback in place ("This is the most recent run on
<corpus>, not an answer from this conversation") instead of presenting it silently as this conversation's trace. - A used thread never lies about its corpus. Opening Chat with an active corpus (
?corpus=) that is not in the conversation's Sources shows a notice — the next answer would search elsewhere — with two honest moves: Addto this thread's Sources, or New chat about . A ?thread=newdeep link (what Get Started's Open Chat uses) opens a fresh conversation scoped to the URL corpus and leaves the used thread alone. - A reasoning model shows its thinking. With Show model thinking on in Chat settings (
ui.chat_stream_include_thinking), a reasoning model's thinking streams in a collapsible panel above the answer — open while it thinks, folded once (and only once) when the answer starts, never persisted with the conversation. Without it (or for models that share nothing), a stage panel shows Searching… then Generating answer… with rotating tips, and SSE keepalives hold the connection open so no proxy times out a silent model. - Follow, jump, resize. A streaming answer follows the scroll only while you sit at the bottom — scrolling up keeps your place and coming back resumes it; a Jump to latest button opens the newest answer at its start when it is off screen; and the chat workbench, like every major panel, resizes from its bottom-right corner (keyed panels remember their height per viewer, main pane and Dock separately).
- Feedback carries its evidence. Helpful / Not helpful record the chunks the answer cited alongside the run, and opening a citation quietly logs a click signal on that chunk for the same run — both feed the learning reranker's triplet mining. A failed, stopped or still-streaming answer offers no rating at all: there is no answer to rate.
Top-bar health pill: the /api/ready breakdown in one click
The top bar's Health control is now a pill: OK · just now or Not OK · 2m ago. The status word is backed by the same health probe the app runs every 30 seconds while the tab is visible, and the label shows how stale the reading is instead of a bare time-of-day — the underlying tooltip carries the full date and time of the last check.
Clicking the pill is no longer a no-op: it opens a component-status popover backed by GET /api/ready's dependency breakdown, with one row per required dependency (the databases, the LiteLLM gateway, the index manifests). Each row carries a ready/unavailable marker, a short non-sensitive detail line, and — when a dependency is down — an operator hint naming the fix.
- A 503 is a status, not an error.
/api/readyanswers200when every required dependency is ready and503— with the same payload shape — when one is not, so the popover can always show which dependency is the problem instead of a generic failure. See Health, Readiness, and Metrics API. - Escape closes the popover and returns focus to the pill; a click outside dismisses it too.
- Open System Status closes the popover and lands on Dashboard → System Status for the detailed view.
- The first reading is not gated on visibility. A page opened in a background tab (or an automation tab, which browsers report as hidden) gets one health probe at mount, so its pill never sits at "— · not checked yet" while the Dashboard reads OK. Only the recurring 30-second poll follows tab visibility.
Concept diagram (the pill's data path only — the full service map is on the generated runtime-topology page):
flowchart LR
  subgraph s_topbar["Top bar (web/src/components/Navigation/HealthPill.tsx)"]
    PILL["Health pill\nstatus + staleness label"]
    POPOVER["Readiness popover\none row per dependency"]
  end
  subgraph s_api["Backend (/api)"]
    HEALTH["GET /api/health\nliveness probe (30s poll)"]
    READY["GET /api/ready\n200 ready / 503 not ready\nsame ReadinessStatus payload"]
    STORE["useHealthStore\nshared in-flight probe"]
  end
  subgraph s_deps["Dependencies probed"]
    PG["Postgres"]
    N4J["Neo4j"]
    LIT["LiteLLM gateway"]
    IDX["Index manifests"]
  end
  PILL -->|"click opens"| POPOVER
  PILL --> STORE
  STORE --> HEALTH
  POPOVER -->|"loadReadiness()"| READY
  READY --> PG
  READY --> N4J
  READY --> LIT
  READY --> IDX
If the pill says Not OK
Open the popover first — it names the dependency and its operator hint (for example, start the database container, or bring the LiteLLM gateway up). For deeper diagnosis go to Dashboard → System Status, or check the raw endpoint directly: curl -sS http://127.0.0.1:58012/api/ready | jq .
RAG → Data Quality reviews what it says it reviews
The Data Quality subtab now fetches what it promises: chunk summaries load with the corpus, and a Corpus keywords panel lists the keywords stored on the corpus that weight retrieval. Empty states say why they are empty — "no build has been run for this corpus yet" versus "could not be loaded" versus "select a corpus" — instead of a blanket "No chunk summaries to show" for every corpus, indexed or not. Generate keywords fills the panel from what was persisted, so it survives a reload.
The Synthetic Lab jump buttons beside each panel are labelled as what they do — "Generate keywords in Synthetic Lab →", not "Corpus Keywords" — carry the recipe they preselect in their tooltip, keep the current corpus in the URL, and Synthetic Lab announces "Recipe preset to … Nothing has run" on arrival. Nothing runs until you start it there.
Index Now on the Indexing subtab is a hard consent gate: the estimate is measured (token/chunk bands, sampled-file counts), a failed or refused estimate blocks the run with an actionable error banner instead of starting unpriced, and the confirmation dialog can no longer open on an unmeasured payload. See Indexing a corpus.
Main tabs (what they’re for)
The UI is organized into top-level tabs. Here’s the practical meaning of each:
| Tab | What you do there | Typical “first click” |
|---|---|---|
| Get Started | Bring-up flow + sanity checks | /web/start |
| Dashboard | System status, monitoring, storage, help | /web/dashboard?subtab=system |
| Chat | Chat UI + chat settings | /web/chat?subtab=ui |
| Grafana | Embedded dashboards, observability catalog, and incident signals (when enabled) | /web/grafana?subtab=overview |
| Benchmark | Run/inspect benchmarks | /web/benchmark |
| RAG | Core tri-brid features (retrieval/indexing/graph/reranker) | /web/rag?subtab=retrieval |
| Eval Analysis | Analyze eval runs and datasets | /web/eval?subtab=analysis |
| Infrastructure | Docker status, MCP servers, paths/stores | /web/infrastructure?subtab=services |
| Admin | Basic/advanced/raw configuration + dependency and secret readiness | /web/admin?subtab=basic |
Subtab routes changed recently
Grafana's subtabs are now Overview, Dashboards, Incidents, and Config; Admin's are Basic, Advanced, Raw, and Dependencies (secret readiness lives under Dependencies); RAG's Reranker subtab id is now reranker (it used to be reranker-config, so ?subtab=reranker — the slug the label suggests — bounced to Data Quality). A bookmark pointing at an old ?subtab= value is corrected with a toast naming what changed, and ?subtab=reranker-config still lands on the Reranker tab. RAG's Learning Reranker subtab id is now learning-reranker (it used to be learning-ranker); the old slug still resolves through the same alias map.
Startup load: Dashboard → Storage is lazy-loaded
To keep first paint cheap and avoid unnecessary database IO, ragweld does not fetch storage/indexing metrics until you open the Storage subtab.
- On initial load of
/web/dashboard?subtab=system, the UI makes zero calls to/api/index/stats. - Open Dashboard → Storage to trigger the fetch and render per-corpus storage and indexing stats.
- If you expected to see numbers but the panel looks empty, you are probably still on the System subtab. Click Storage (or use the panel’s Refresh control) to populate it.
Verify in your browser’s Network panel
- Go to
/web/dashboard(the System subtab). - Open DevTools → Network and filter for
/api/index/stats. - You should see no requests until you click the Storage subtab.
- This behavior is by design to reduce background load on Postgres at startup.
Dashboard → System: Recent Index Runs
The System subtab’s Recent Index Runs panel lists one row per corpus: its latest persisted index run with status (complete in green, error in red, never indexed when the corpus has no runs), completion time, chunk count, figures described (with a failed count in parentheses when any), and a compact Run accounting cell — the saved run's accounting state and, once settled, its native cost. “Never indexed” and “unavailable” (the request failed) are different answers, and the panel colors them differently.
Runtime-managed corpora are excluded from this panel: the chat Recall corpus (recall_default) and the two Codex session corpora are registered by the runtime, carry the typed internal flag on Corpus, and index through their own path — so they have no operator-run index run and would otherwise sit here reading “never indexed” forever. The same marker keeps them out of “delete all unindexed corpora” cleanup, since runtime-registered corpora are never the operator’s to clean up.
This panel refreshes with the status poll now
Native accounting can settle after indexing ends, so the panel refreshes its saved summaries on the same 30-second status poll. These listing reads are pure reads — they never rewrite a run summary as a side effect of displaying it. Each cell's headline reads <cost> recorded · <state> (for example $0.01 recorded · Complete), with the full breakdown (frozen estimate, native spend, request census, denominators) behind its Details disclosure; see Native run accounting.
If something looks empty
Most RAG panels depend on a selected corpus and a completed index. If you haven’t indexed yet, start at Indexing.
Dashboard → System: cost cards that say what they mean
The System subtab's index panel renders the per-corpus cost cards with the distinctions the underlying run record actually makes:
- A metered
$0.0000says so. An embedding cost of exactly zero with real tokens processed — a local or no-charge embedding model — renders as$0.0000 (no charge), distinguishable fromN/A, which means no meter ran at all. - Semantic KG Cost always appears. A phase that did not run reads
not run, never a silently missing card that could be mistaken for$0.00. - Total Cost carries its ceiling. When figure descriptions contributed, the total is priced from the full per-figure completion budget, so it is labelled
≤ $X— an upper bound, never presented as an exact charge. See Indexing a corpus for how the figure ceiling is computed. - Byte figures are binary. The panel's byte figures use KiB/MiB/GiB (the values are divided by 1024), matching the Storage subtab's labels.
Dashboard → Monitoring: alerts read live from Alertmanager
The Monitoring subtab's Alerts panel calls GET /api/observability/alerts, which reads Alertmanager's own alerts route on every refresh — so what you see is what Alertmanager is holding right now, with a firing count that excludes silenced and inhibited alerts.
- Alert rows carry severity tones — critical/page in red, warning in amber, everything else neutral — and silenced/inhibited rows are labeled, so you can tell why something is being held back rather than wondering where it went.
- An empty result is evidence, not a guess — the empty state names the Alertmanager URL that was read.
- A failure is a typed error card — if Alertmanager is unconfigured, unreachable, or answering with something other than alerts, the panel shows the API's own reason and operator hint (typically: set
tracing.alertmanager_base_url), with a Retry button and a link into Infrastructure → Monitoring. It never falls back to a bare "Failed to load" or an empty list that would read as good news.
Full alerting controls (Alertmanager endpoints, receivers, delivery policy) live in Alert webhooks.
Dashboard → Monitoring: Recent Query Traces
Below the alerts panel, Recent Query Traces lists the last 10 search and chat queries — a date-and-time timestamp, the query text, and the corpus each ran against. The table deliberately has no Duration column: the query log records no per-request timing, so the table never shows a column it cannot populate (a column of — for every row would look like missing data). For latency work use /api/metrics, the trace viewer, or the Grafana dashboards rather than this table; the timestamps include the date, so a list spanning days cannot read as if it ran backwards.
The panel's description links straight into the Eval Analysis tab — per-run drilldown, per-question detail, and AI comparison analysis live there — and the table's third column header reads Corpus, matching the workbench's corpus-first naming.
Dashboard → Storage: byte tiles, count tiles, and the capacity planner
The Storage subtab shows one tile per storage component, in two deliberately different formats:
- Byte tiles (chunks, vectors, indexes, Postgres totals) carry a
% of totalshare line and a background fill bar, because they are slices of a real byte total and the shares sum to roughly 100%. - Count tiles (Qdrant points, keywords) show only the tally —
1,315 points,247 keywords. A count has no share of a byte total, so a percentage would always read 0.0% and the fill bar would be meaningless; neither is rendered. - An unmeasured store is "n/a" with the reason. The Neo4j store tile reads
n/a— Neo4j 5 exposes no store-size procedure and the data volume is not host-readable — with no share line and no fill bar, and it contributes nothing to the byte total. A zero would read as a measured empty graph beside thousands of nodes; see Index Dashboard models.
Byte figures are labelled in binary units (KiB / MiB / GiB) here and on Dashboard → System Status, because both divide by 1024 — the two subtabs agree on the same number under the same label.
Below the live tiles sits the Storage Calculator Suite, a hypothetical capacity planner — editing its inputs never changes a stored index. When an indexed corpus is active, the planner seeds itself from that corpus (stored chunk bytes for corpus size, the mean chunk size across stored points, embedding dimensions from config) and says so in a banner naming the source of every prefilled number; with no indexed corpus it holds generic planning defaults and says that instead. The right-hand Fit Analysis panel's Corpus Size / Chunk Size / Embedding Dims fields are independent scenario inputs — editing them does not move the left panel — while Hydration %, Replication and HNSW overhead are read from the left panel.
The single most important UI control: corpus selection
Many screens include a corpus selector (sometimes labeled “repo”). This determines the corpus_id used for:
- indexing
- retrieval
- graph views
- per-corpus configuration and stats
If you see “wrong results”, the most common cause is simply that you’re looking at the wrong corpus.
Quick troubleshooting inside the UI
Where to check readiness
- Dashboard → System Status
/api/ready(raw endpoint)- The top-bar Health pill — click it for the per-dependency readiness popover without leaving the page
Where to find logs
- Infrastructure → Docker (if you’re running via Docker)
- Your terminal where
./start.shis running
Where to verify secrets
- Admin → Dependencies (dependency and secret readiness)
/api/secrets/check?...
Shell polish worth knowing (recent changes)
A handful of workbench-shell behaviors changed recently; none change any workflow, but they explain things you may notice:
- Unknown routes say so. A URL nothing is routed to now renders a "Page not found" card naming the attempted path, with links to every tab — previously it rendered a silently empty page under a "Home" breadcrumb.
- Bad deep links are corrected out loud. An unknown
?subtab=or?corpus=value is replaced (and the URL cleaned) with a toast naming what was wrong and what you landed on, instead of a silent rewrite that made a broken bookmark look like a working link. - The window title names where you are. The browser tab reads
Dashboard · Storage — <corpus> — ragweld, so a multi-tab operator session is tellable apart at a glance. - The glossary is organized by its own data. Category chips come from the
categoryfield indata/glossary.json(one badge per category), chip counts describe the current search, and search matches on word boundaries — searchingfigurefinds the figure settings instead of everything containing "configured". - Keyboard access. Ctrl+K no longer opens on focus (it opens on click, Enter, or Ctrl+K), traps focus while open and returns it on close; the dock picker supports arrow keys + Enter like Ctrl+K; the top bar's tab stops show a visible focus ring.
- Admin → Basic names its scope. A banner shows which corpus the page writes to, and every field carries its
corpus/globalscope chip even in the trimmed Basic view — a save can no longer look like a global default when it is a per-corpus value. - Credential fields explain themselves. The Postgres DSN shows a "Password configured" chip and a note that
[redacted]means "kept in the backend", and nested config fields read their units properly ("Timeout (seconds)", not "Timeout S"). See Security. - Config edits stage; Apply writes. Every config edit — a number, a toggle, a chunking-strategy card, a raw JSON section — stages locally, and the footer's Apply button counts what is staged (
Apply 3 changes) with a briefSavedacknowledgement after a successful write. A rejected save shows the server's per-field message under the field itself, and a 409 conflict offers Reload latest. See Configuration. - Destructive actions confirm themselves. Irreversible dialogs focus Cancel first — a stray Enter declines rather than destroys — and the biggest ones (deleting a corpus's index) require typing the corpus id before the confirm button enables. See Testing.
- Admin → Raw is read-only until you opt in. The raw section editor opens read-only in a Monaco JSON view; Edit section enables it, Cancel reverts to the last loaded JSON, invalid JSON is caught before saving, and a save stages the whole-section replacement for Apply.
- Admin → Dependencies loads out loud. The readiness probe can take ~25 s on a cold cache, so the panel shows a spinner with an elapsed counter, skeleton cards, and a "still working" note past ~8 seconds instead of a bare sentence that reads as a hung page.
- The dock has one set of controls. When nothing is docked, Dock Chat / Dock Current / Choose… live in the dock header and the empty body is guidance text — the duplicate control set in the empty body is gone. Docking the page you are on (which moves the main view to Chat) now announces it with a one-click undo toast instead of silently relocating the page.
- The settings rail links, it doesn't duplicate. The rail's old "Quick Model Switcher" — a second copy of generation/embedding/reranker assignment with its own Apply button — is gone; it now links to RAG → Retrieval, the single surface that assigns models. Long lineage/eval ids render middle-truncated with a one-click copy full id control.
- The wizard follows a corpus that still exists. Steps 3 and 4 now name the corpus they act on (
This step works on <name> (<corpus_id>)), and a persisted wizard corpus the registry no longer has — deleted while the wizard kept its id — is replaced by the active corpus (or cleared), instead of greying the steps out over a corpus that no longer exists while the corpus in the URL is indexed and ready. Open Chat at the end deep-links into a fresh conversation scoped to that corpus (?thread=new). - The wizard gates semantic indexing on the same schema review as Indexing. Step 3 reads the selected corpus's scoped graph policy before anything is estimated: with the semantic policy on and no reviewed schema, the start button refuses in place with a Review graph schema → deep link into RAG → Indexing, and no index request is ever sent. The estimate consent dialog is the same one the Indexing tab uses — a short headline (files, chunks, estimated cost/time, uncertainty) with every number and the saved estimate assumptions behind an Estimate details drawer — and the button shows Preparing… while the estimator measures.
- Get Started lays out by its pane, not the window. The wizard's container keys its layout to the width of its own pane (
#tab-startis a CSS size container), so it renders readably both as the main page and when swapped into the narrow dock pane — navigating to Get Started while another tab is docked no longer wraps step headings and warnings one character per line. Swapping tabs between the main pane and the dock is intentional behavior; the wizard just stays legible through it. - Docked chat keeps its buttons whole. The chat composer's text column is the only element allowed to shrink in a narrow docked pane, so Attach and Send keep their labels on one line instead of wrapping letter-per-line — the dock body inherits
overflow-wrap: anywherefor long identifiers, and the textarea's intrinsic minimum width used to squeeze the button column instead. - Corpus controls read fresh state when they open. The corpus picker and the Chat source dropdown force a registry refresh every time they open, and a completed index refreshes the registry before any control can open on the stale list — a corpus indexed by a script or in another session no longer sits there reading "Never indexed". A failed refresh is announced in place (
role=alert) in the source dropdown instead of silently keeping stale rows. - "Delete all unindexed corpora" cannot destroy fresh work. Cleanup re-checks its candidates against a just-fetched registry snapshot (aborting if that fetch fails), and the server independently refuses with a typed
409 corpus_already_indexedwhen a corpus finished indexing between the listing and the delete — the raced corpus is skipped and reconciled on the final refresh. See Corpus vs repo_id. - The mobile shell keeps its panes usable. Below 900px the top bar wraps to its natural height instead of clipping a long corpus name, the main pane and the settings rail stack with the pane stack — not the page — owning vertical scroll, the RAG subtabs stay on one horizontally scrollable row, and the navigation drawer still opens below the full wrapped header. The Apply conflict footer and a docked document each get their own minimum space, and the sidepanel resize handle stays disabled through the widths where the header can wrap.